Demographics tell an incomplete story
As I’m sure you all know, the United States just held it’s Presidential election, which means it’s demographic central over here.
Lots and lots of charts that look like these:

While there is A LOT to be concerned about in these charts, and lots of caveats about the accuracy of exit polls, that is not what I want to focus on here.
Rather, I want to highlight how focusing ONLY on demographic details leaves us with insufficient and inaccurate data for developing effective strategies for change.
The above charts show us a single demographic detail (gender, ethnicity, etc.) and one action they took (who they voted for).
That data does not tell us why people in those demographic categories voted the way they did.
Which leaves us susceptible to making inaccurate assumptions about their ‘why’ and increases the potential of dismissing important audience segments who may be open to change.
This is because demographics without psychographics can introduce bias and ignore shifting behavior patterns.
Demographics introduce bias
When reviewing socio-economic data, we are at risk of making sweeping generalizations based on our own implicit and explicit biases.
This happens when we look at Education Levels and conclude that our audience isn’t taking action because “they’re not educated”.
Or, we review Household Income data and conclude that our audiences don’t take action “because they’re poor”.
Or, we see the percentage of people who are 65 or over and assume they won’t be receptive to changing their behaviors.
These unfounded assumptions lead to ineffective behavior change efforts that focus on the wrong root cause, or that dismiss entire audience segments who we’ve (inaccurately) deemed unreachable.
The demographics-action gap
(I just made that phrase up)
Across the globe, “traditional” behaviors based on gender, age, education, ethnicity, occupation, etc. have been shifting greatly for years.
Yet we don’t regularly account for this when reviewing demographic data, especially results that focus on a singular trait (as opposed to showing overlapping demographic traits).
The reality is that one’s demographic profile is no longer an accurate indicator for what they believe or how they will behave.
In 2014, Trendwatching called this shift “Post-Demographic Consumerism”.
POST-DEMOGRAPHIC CONSUMERISM | People – of all ages and in all markets – are constructing their own identities more freely than ever.
As a result, consumption patterns are no longer defined by ‘traditional’ demographic segments such as age, gender, location, income, family status and more. [read more about this trend here]For example: “If you look at the list of the 1,000 favourite artists for 60-year-olds and the 1,000 favourite artists for 13-year-olds, there is a 40% overlap.” » George Ergatoudis (Head of Music, BBC Radio 1), May 2014
If we start and end our audience analysis with demographic details, then we will likely miss important audience segments with shared interests and similar behavior patterns, who may be equally open to change.
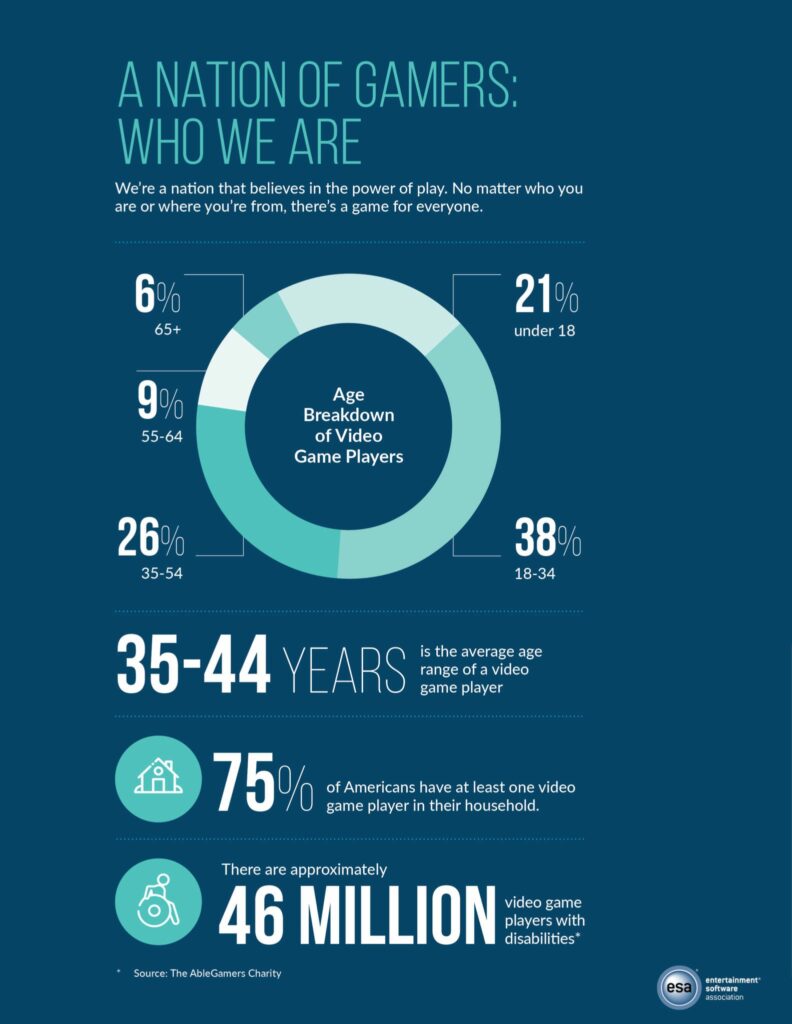
Let’s look at gaming for an example.
I haven’t played video games since I was a teenager (and, frankly, I was never very good at them).
When I think about who plays video games, I default to “teenage boys”, which is probably a commonly held assumption.
And while I wouldn’t be wrong about that, I would only be partially right.
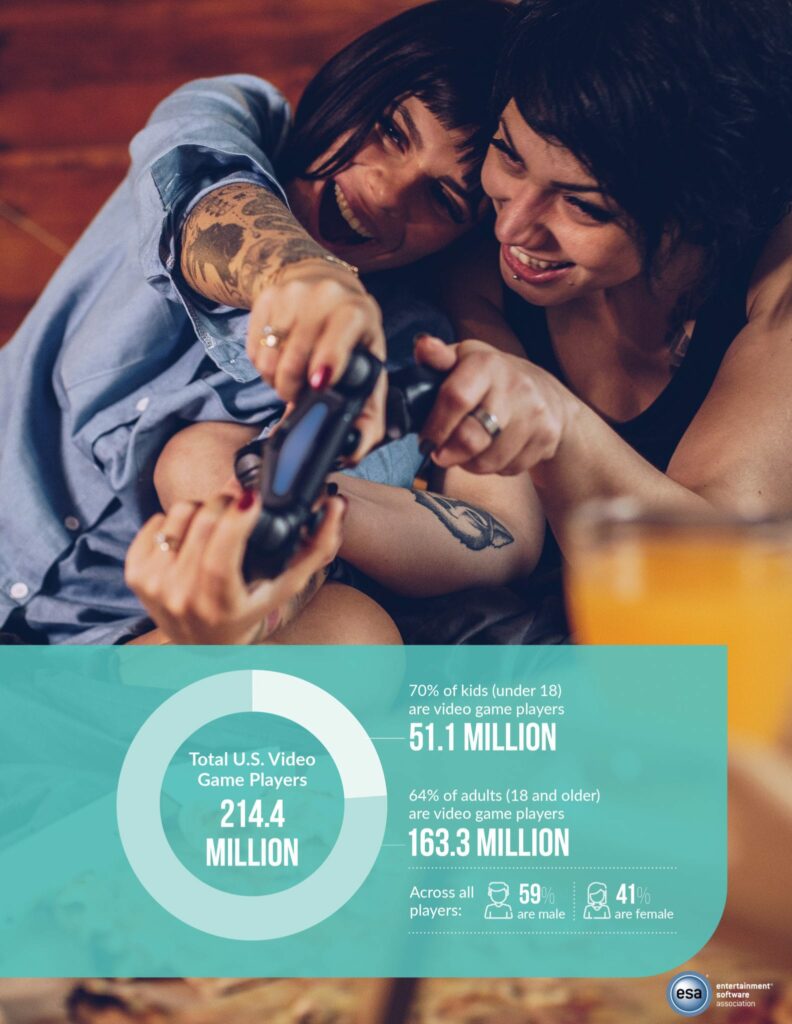
Players under 18 years old (all genders) make up only 21% of gamers, and players who identify as male represent 59% of gamers (across all categories). [source: Entertainment Software Association]
Furthermore, my explicit bias would lead me to assume that teenage boys play video games because they’re bored, disinterested in studying and doing their homework, and want to ignore their parents.
Yet, the same data indicates that people (of all ages) play video games because it provides mental stimulation and helps with problem solving, while also providing positive social interactions with friends and family.
If I developed a communication strategy based on my assumption that gamers are just teenage boys who play games to disconnect, then I would miss the mark on why gaming is important to them, while also ignoring about 40% of gamers under the age of 18 AND nearly 80% of gamers overall.
That doesn’t sound very effective or efficient.
Leading with psychographics instead
With demographics becoming more fluid and less indicative of behavior patterns, then it’s important to lead with psychographics when segmenting audiences.
A great example of developing psychographic profiles is the Yale Program on Climate Change Communications’ “Global Warming’s Six Americas“.
This project segmented American adults into six categories based on their likelihood and reasons for taking (or not taking) climate actions. See graphic below.
Each of these six categories has its own set of demographic detail, and demographic traits may even skew higher and lower for some categories, but the efforts to engage, reach and communicate with particular segments does not rely solely upon those factors.

Making this shift may feel uncomfortable for us, and it can make it harder to visualize what the audience “looks like”.
Yet, the shift towards leading with psychographic data is critical to make.
Not only because it will help us develop more effective engagement efforts that are tailored to the drivers and needs of our audience.
But also because it creates a more inclusive starting point that does not dismiss population segments based on implicit (or explicit) biases or antiquated expectations of behavior.